
Philippine Coffee Statistics: Production, Imports, and Consumption in 2026
Updated September 11, 2026. A source-linked guide for café owners, buyers, and readers researching the Philippine coffee industry.
Philippine coffee statistics are most useful when the reporting period and unit travel with the number. This guide brings together national market estimates, a provincial production update, and a government development announcement. Each answers a different question about supply and demand.
Freshly roasted Philippine coffee
Shop our coffee beans: Arabica, Robusta, Kapeng Barako and signature blends, roasted daily in Manila, whole bean or ground. Not sure which? Take the Coffee Match Quiz.
Shop Coffee Beans →Philippine coffee statistics at a glance
USDA’s July 2026 report gives the following figures. Philippine marketing years run July–June; these are not calendar-year 2026 totals.
| Indicator | 2025/26 estimate | 2026/27 forecast |
|---|---|---|
| Production | 27,000 tonnes | 28,500 tonnes |
| Total imports | 364,500 tonnes | 375,000 tonnes |
| Domestic consumption | 391,500 tonnes | 403,500 tonnes |
| Soluble imports | 330,000 tonnes | 330,000 tonnes |
Figures are green-bean equivalents, converted from 60-kg bags (bags × 0.06 = tonnes). Soluble imports are included in total imports. Source: USDA, Coffee: World Markets and Trade, July 2026, pp. 6–10.
Philippine coffee statistics: imports and consumption
Calculated from that table, 2026/27 imports equal about 93% of consumption; production equals about 7%. Soluble coffee represents 88% of projected imports. These are volume comparisons, not café sales shares. USDA converts roasted coffee using 1.19 and soluble coffee using 2.6, so the table does not describe the physical weight of packaged instant coffee. Source and conversion notes: USDA, p. 9.
A 2026 production update from Sultan Kudarat
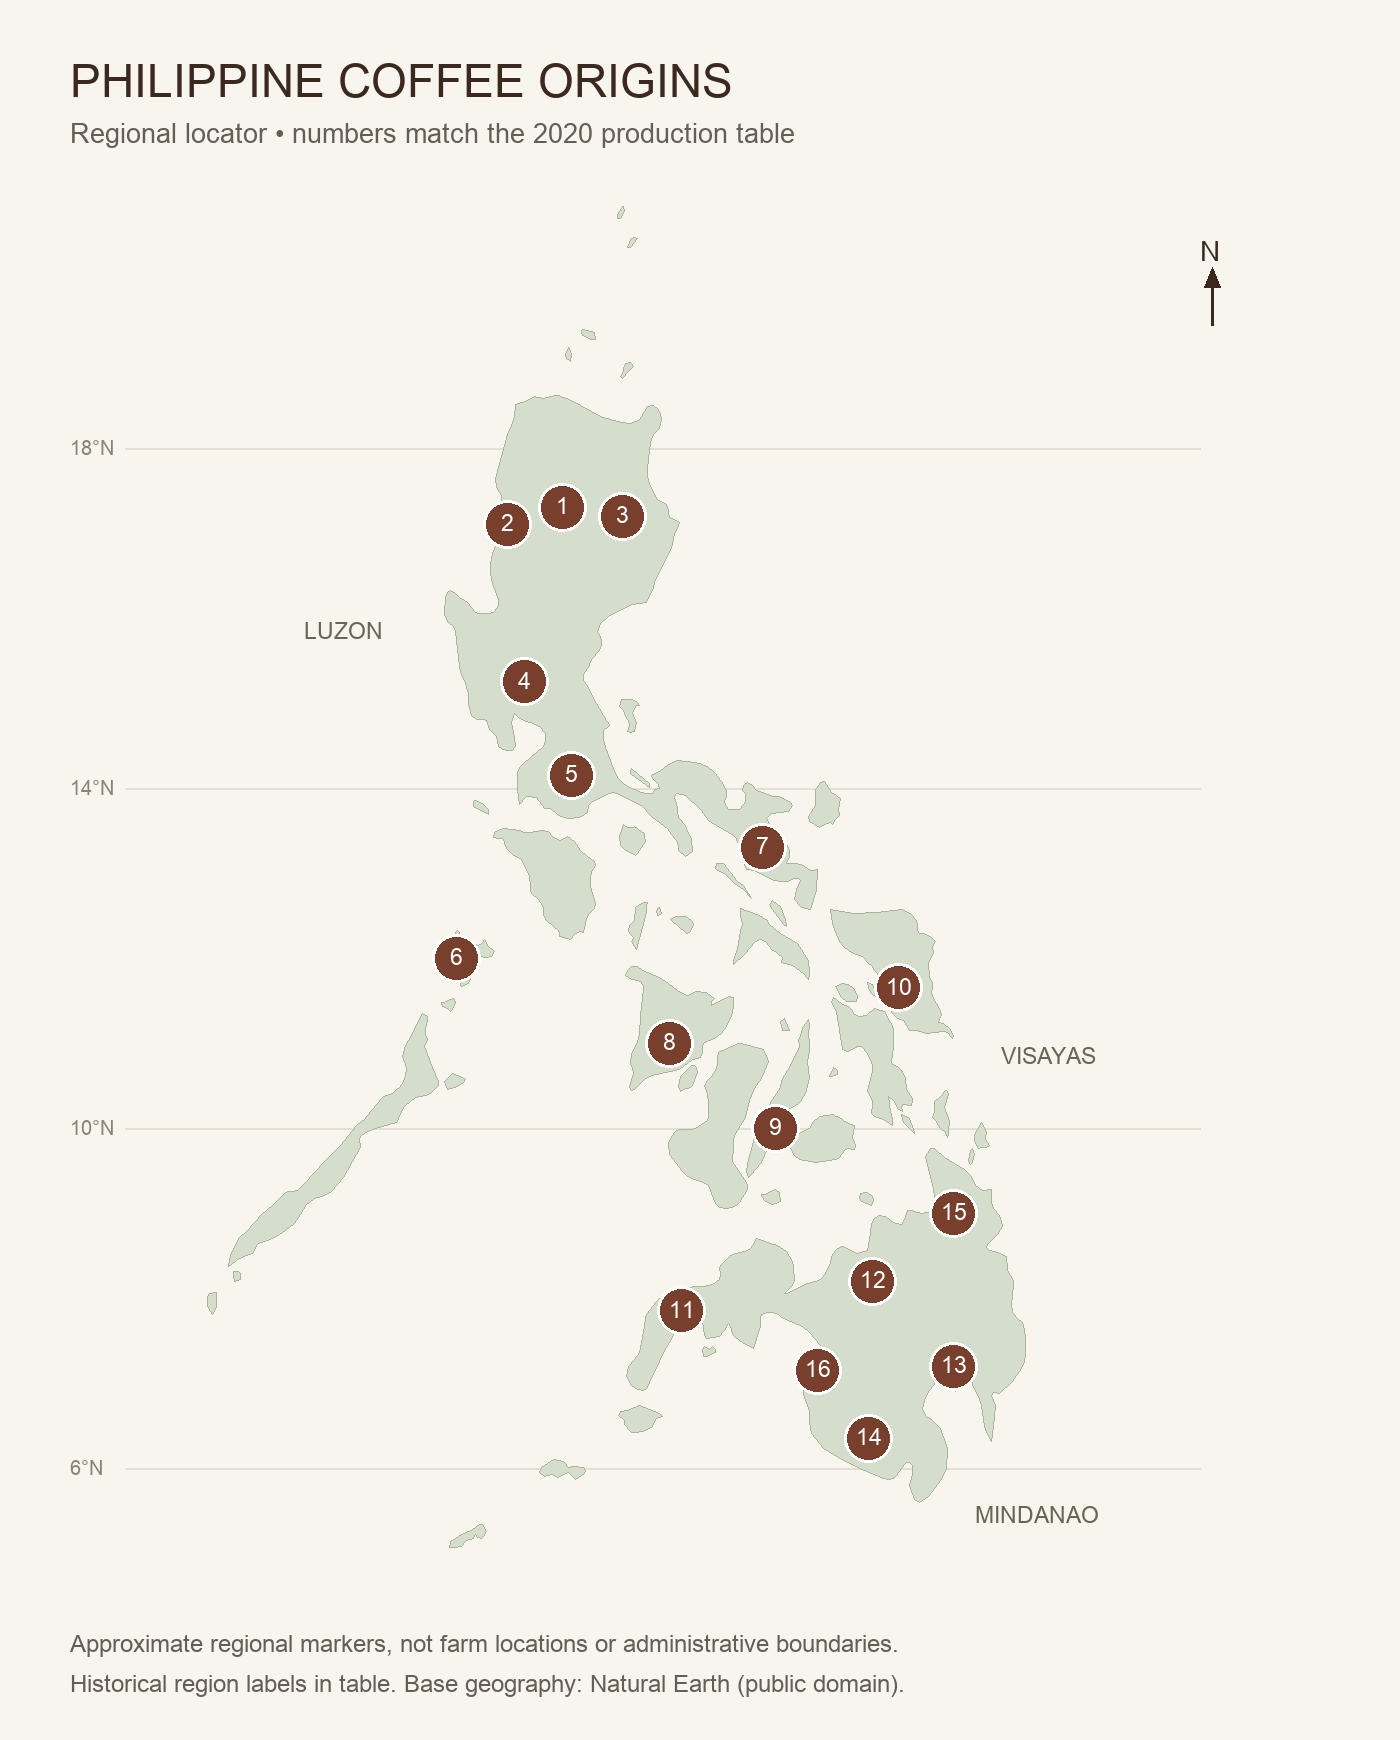
A provincial release provides a more local view. The Philippine Statistics Authority reported 6,516.39 metric tonnes of coffee in Sultan Kudarat in January–March 2026, up 1.39% from 6,426.79 tonnes in the same quarter of 2025.
The total conceals different results by variety: Robusta increased 16.24% to 5,112.33 tonnes, while Arabica declined 30.79% to 1,404.06 tonnes. These are provincial quarterly figures, not a national annual harvest. Source: PSA, Other Crops Situation in Sultan Kudarat, released September 2, 2026.
For buyers, the practical lesson is to ask about the specific variety and origin they need. An increase in a province’s total output does not mean every coffee variety became more available.
Support Philippine coffee farmers this season with a Christmas coffee gift set of locally grown beans.
What is being done to expand local supply?
On May 9, 2026, the Department of Agriculture announced that ₱2.5 billion had been earmarked for a farm-to-market road network intended to provide access to 29,000 hectares in Sultan Kudarat. The announcement also identified Bukidnon, Davao del Sur, and Agusan del Sur within its broader coffee-development plans. Source: Department of Agriculture, May 9, 2026.
This is a development commitment. The 29,000 hectares should not be described as newly planted, harvested, or already producing coffee. When tracking progress, distinguish funding announcements, road completion, planting, and commercial harvests.
How café owners can use Philippine coffee statistics
Treat Philippine coffee statistics as background for supplier conversations. Before committing to a wholesale coffee bean order, compare samples, roast dates, delivery lead times, minimum order quantities, and the supplier’s ability to repeat the flavor profile your customers expect.
For purchasing context, consult our Philippine coffee bean price tracker and supplier negotiation framework. Confirm current quotations and terms directly with suppliers; national production figures do not establish a particular lot’s price.
Ask for the origin and variety of each offering, particularly when developing a menu around Philippine-grown coffee. A local roasting business and a Philippine-grown bean describe different parts of the supply chain; a clear product specification should identify both.
To discuss coffee for your café, restaurant, or office, explore Caffeine Brothers’ coffee range and wholesale options.
How to cite Philippine coffee statistics correctly
- Keep the period: include the marketing year or quarter rather than shortening every figure to “in 2026.”
- Keep the status: identify forecasts, estimates, and reported production separately.
- Keep the unit: specify green-bean equivalent where applicable.
- Keep the geography: provincial output cannot stand in for a Philippine total.
- Keep the source edition: the USDA PDF address is updated over time; identify the July 2026 edition and page when citing this table.
Methodology: Caffeine Brothers compiled the linked official publications and calculated the conversions and ratios shown above. Figures may be revised. This article does not present a completed January–December 2026 statistical total.
 Next Post