
Philippine Coffee-Growing Regions: A Map of Origins and Production Data
Philippine coffee comes from a wide range of growing areas, and an origin label is only the start of the story. This guide pairs a regional locator map with an official historical production table, then explains how to use those references when buying beans.
Data scope: the regional comparison below covers 2020, using the green-coffee-bean column of the Department of Agriculture’s published roadmap. It is a historical reference, not a 2026 production ranking. A separate 2025 provincial update appears below.
Map of Philippine coffee-growing regions
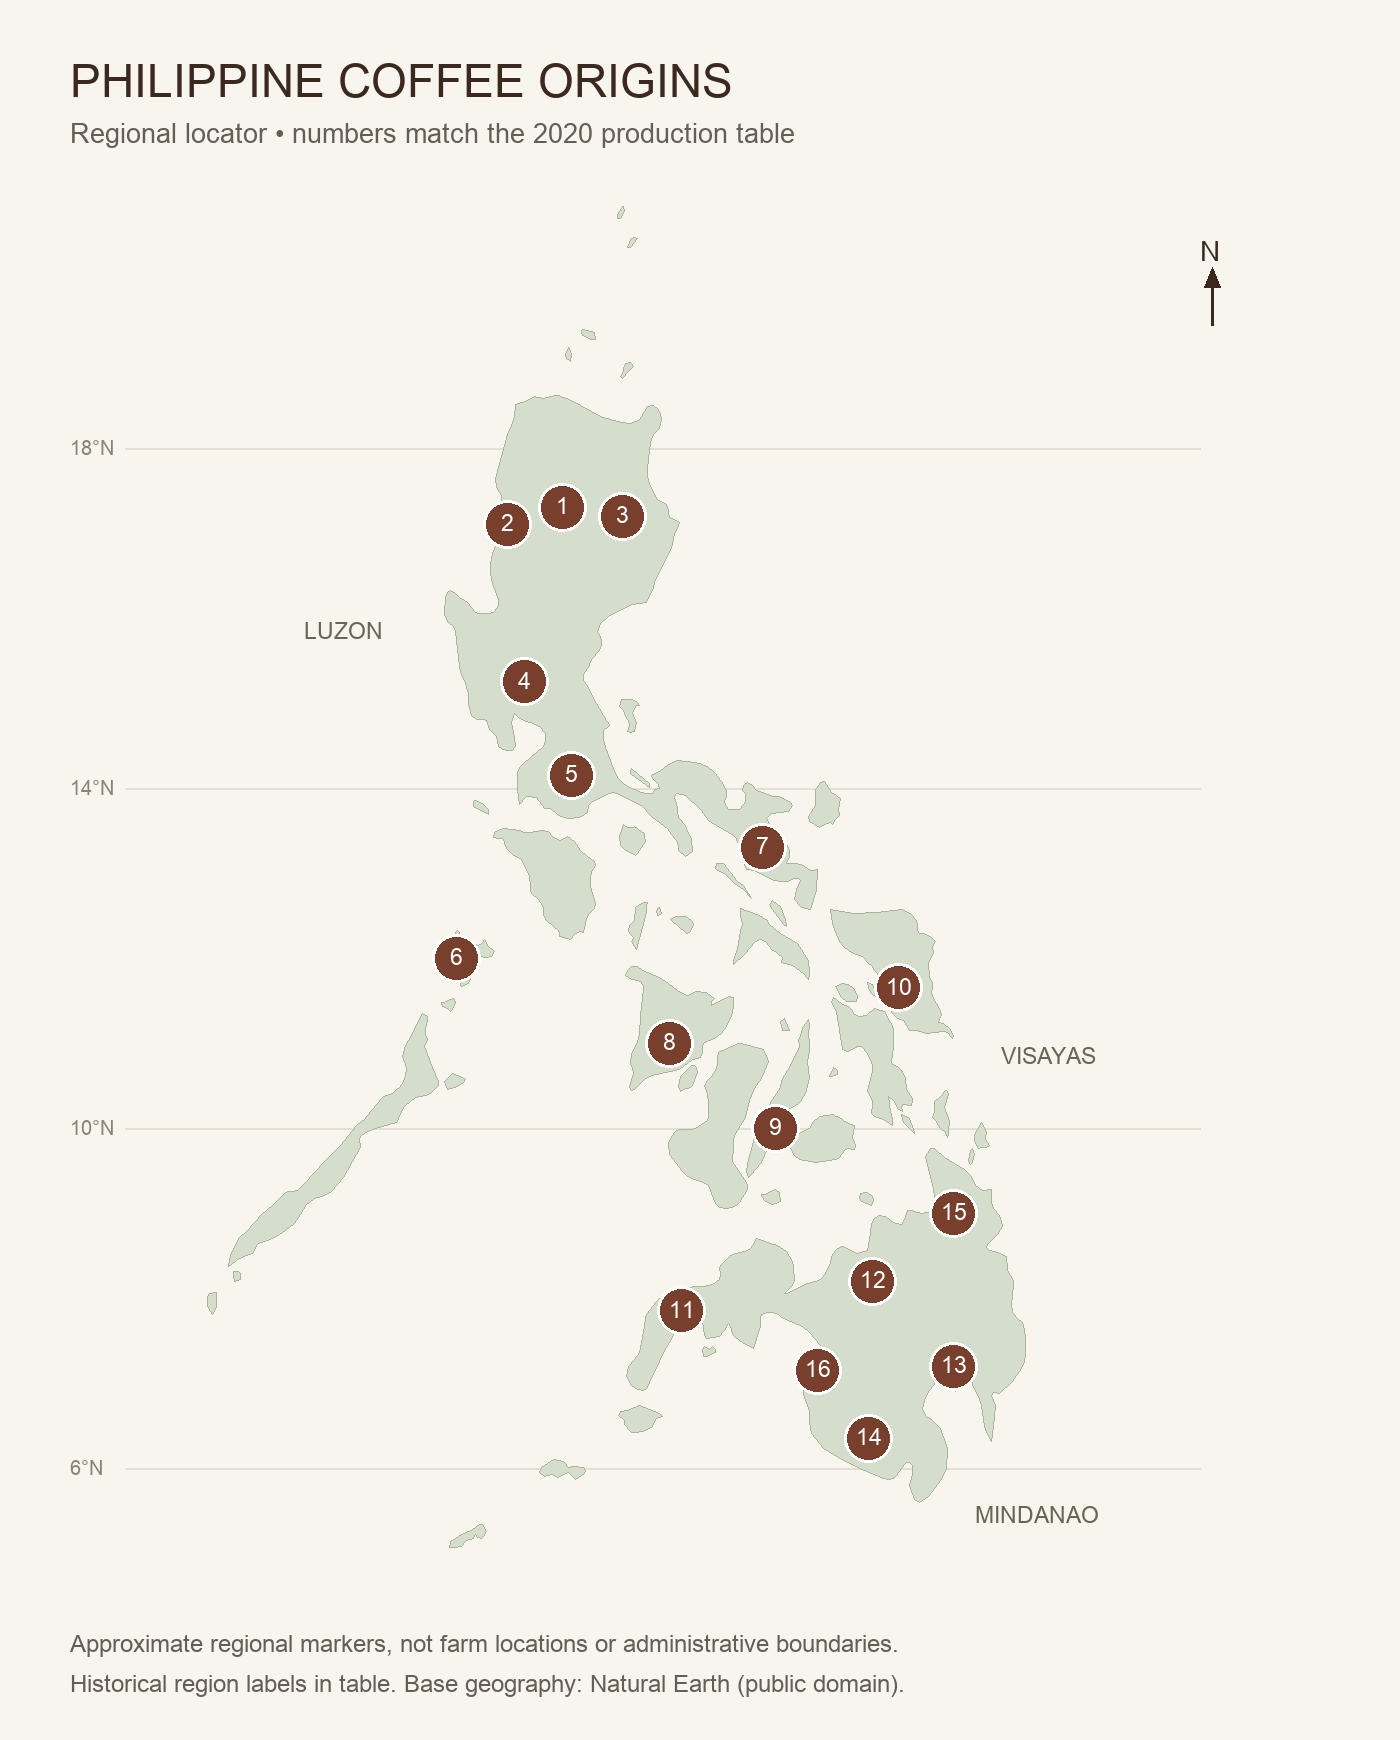
Regional coffee production: 2020 reference table
Values are reproduced from Table 7, printed pages 19–20, of the Philippine Coffee Industry Roadmap 2021–2025, which identifies PSA as its source. Units: metric tons of green coffee beans (MT GCB). Map numbers follow the source’s regional order, not production rank.
| Map no. | Region, as labeled in source | 2020 production (MT GCB) |
|---|---|---|
| 1 | Cordillera Administrative Region (CAR) | 1,003.14 |
| 2 | Ilocos Region | 76.58 |
| 3 | Cagayan Valley | 523.08 |
| 4 | Central Luzon | 393.77 |
| 5 | CALABARZON | 636.06 |
| 6 | MIMAROPA | 70.86 |
| 7 | Bicol Region | 80.14 |
| 8 | Western Visayas | 2,089.84 |
| 9 | Central Visayas | 60.37 |
| 10 | Eastern Visayas | 28.28 |
| 11 | Zamboanga Peninsula | 257.19 |
| 12 | Northern Mindanao | 2,798.76 |
| 13 | Davao Region | 5,413.12 |
| 14 | SOCCSKSARGEN | 10,794.24 |
| 15 | CARAGA | 811.12 |
| 16 | ARMM (source label) | 5,281.55 |
Source note: these rows sum to 30,318.10 MT; the source’s national row reports 30,320.48 MT. The 2.38 MT discrepancy is left unresolved. We preserve the printed regional values and do not derive national shares from them. Historical labels, including “ARMM,” are retained for traceability; they should not be read as a statement of today’s administrative geography.
Growing areas behind the regional names
Regional statistics aggregate many producers. For sourcing, move from the region to the province, municipality, and producer named on the lot.
- Cagayan Valley: a DA regional report identifies coffee grower organizations including Kasibu, Kalahan, and Kayapa groups. These are more specific leads for understanding the region’s coffee activity than a regional total alone.
- Northern Mindanao and SOCCSKSARGEN: a DA report on its Mindanao Coffee Robusta Project documents work with growers in Bukidnon and Sultan Kudarat. A project’s participants and results should not be mistaken for an inventory of every farm in either region.
- CALABARZON: Quezon’s official crop release provides a provincial example with separate coffee-type figures, illustrating why a broad regional label can hide a mix of coffees.
A newer provincial snapshot: Quezon in 2025
The PSA’s preliminary 2025 Quezon release, dated April 30, 2026, reports 77.30 MT of green coffee beans, compared with 99.81 MT in 2024. Its reported decline is 22.6%. Robusta contributed 37.24 MT and Excelsa 23.01 MT; the release also records Liberica production.
This is a province-level annual update. It does not replace the 2020 regional table or describe the total output of CALABARZON. Keeping period, geography, and product form visible prevents an apparently precise comparison from mixing unlike numbers.
How café buyers can use this guide
Use the map to locate an origin, then ask the supplier for details that apply to the actual coffee offered:
- Origin: province, municipality, farm or cooperative, and whether the lot combines several producers.
- Coffee identity: species or blend components. Our guide to Philippine coffee types explains the terminology.
- Lot information: harvest period, processing method, available quantity, and roast date for roasted beans.
- Drink performance: request a sample and assess it using your intended recipe before making a larger order.
Production volume is not a cup-quality score or a promise of stock availability. A small producing area can still supply a useful lot, while a large regional total does not establish what a particular supplier has ready to sell.
For your next order, explore Caffeine Brothers and confirm the origin and lot details of the coffee you select. Use official statistics for context and the supplier’s product information for the purchasing decision.
Sources checked September 16, 2026. Regional data: historical 2020 benchmark; Quezon update: preliminary 2025 annual figures. Map created for this guide.
 Previous Post


